
Company Name: Chartify
Chartify
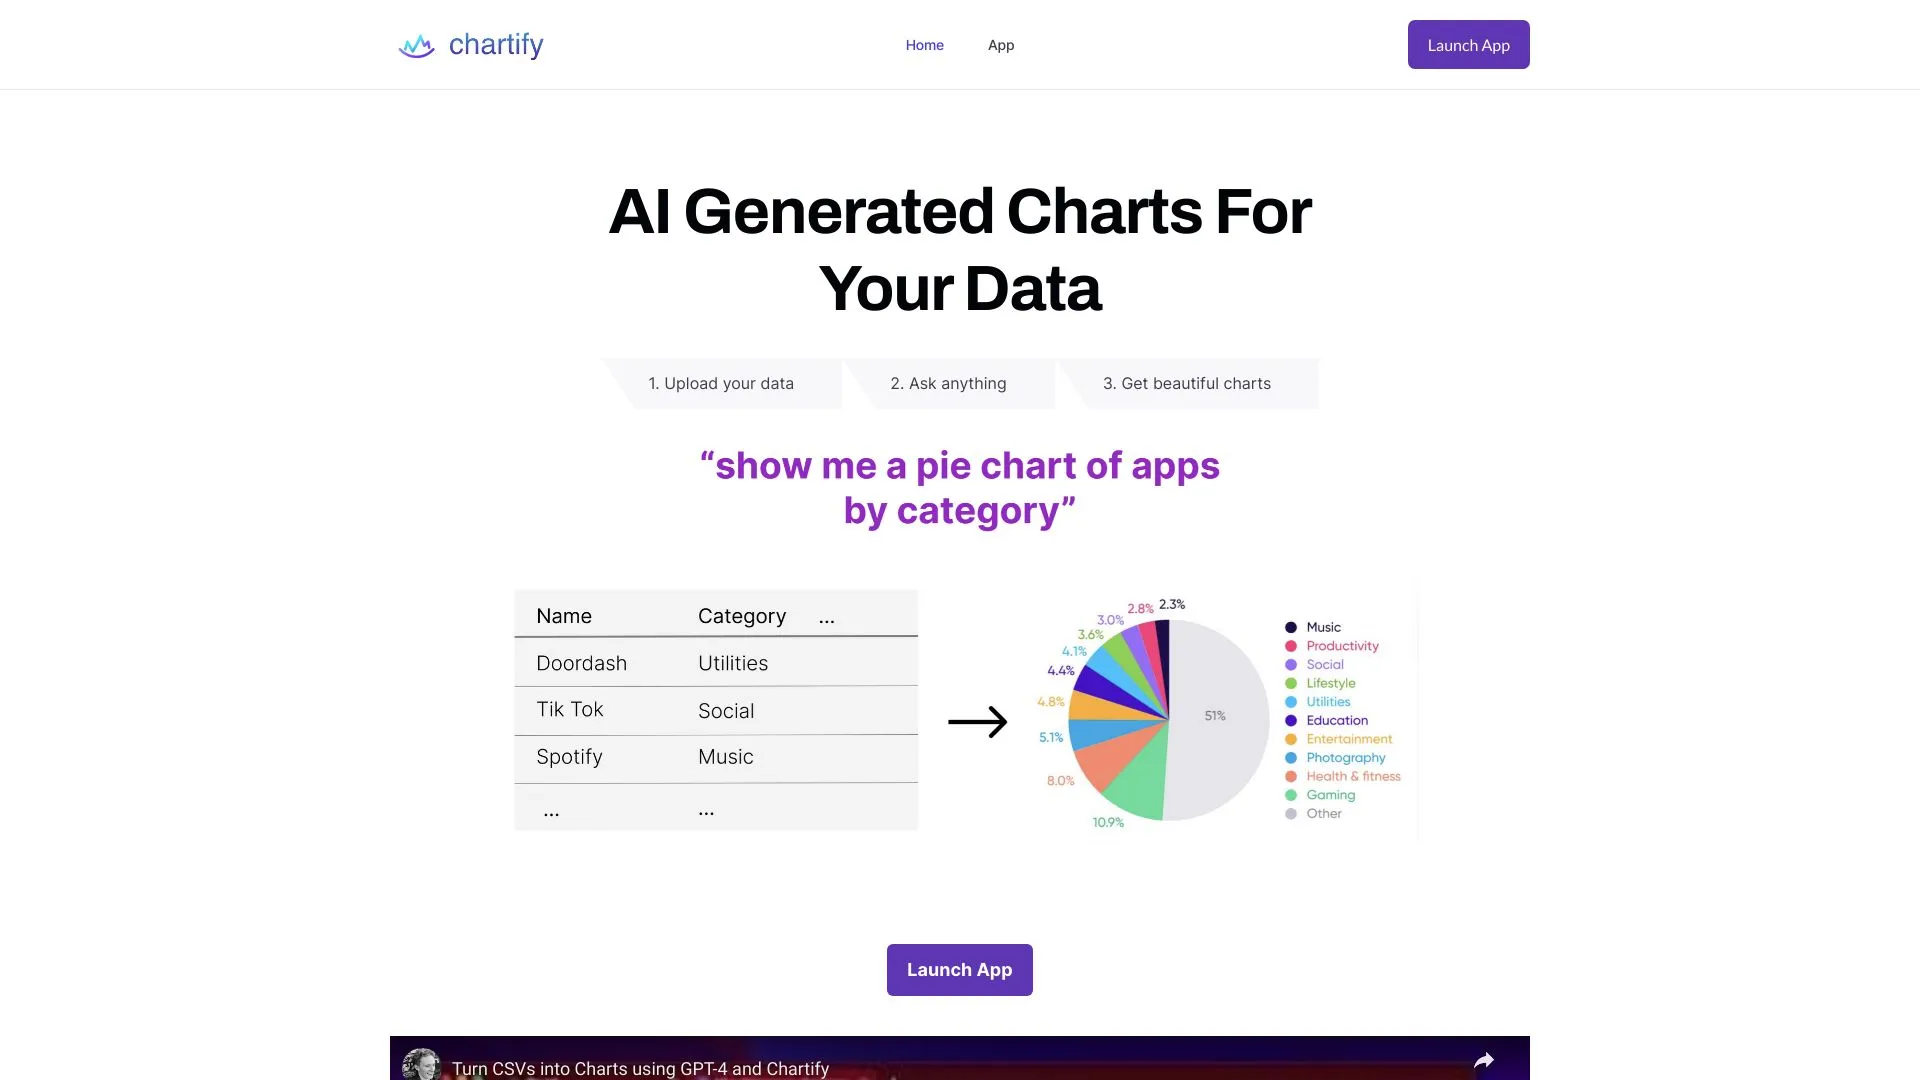
Chartify is an AI-powered data visualization tool designed to transform raw data into stunning charts and graphs effortlessly. Perfect for professionals looking to enhance reports and presentations.
Support Email: [email protected]
Overview
What is Chartify?
Chartify is a revolutionary AI tool that streamlines the creation of visual charts from raw data. It supports CSV files and database tables, allowing users to effortlessly generate a variety of graph types such as bar charts, pie charts, and line graphs. Using OpenAI’s GPT-3 model, Chartify enables users to ask natural language questions about their data, ensuring insightful and interactive visualizations that are both easy to create and understand.
Who will use Chartify?
- Data Analysts
- Marketers
- Business Intelligence Professionals
- Researchers
- Educators
How to use the Chartify?
- Step1: Visit the Chartify website.
- Step2: Upload your CSV file or connect to your database.
- Step3: Select the type of chart you want to generate.
- Step4: Customize your chart with the available tools.
- Step5: Export or share your chart as needed.
Platform
- web
Key Features
The Core Features of Chartify
- AI-powered data visualization
- Supports CSV and database files
- Wide range of chart types
- Natural language query support
The Benefits of Chartify
- Simplifies data visualization
- Saves time on manual chart creation
- Enhances data understanding
- Interactive and insightful visualizations
Chartify’s Main Use Cases & Applications
- Creating business reports
- Marketing analysis
- Research data presentation
- Educational purposes
Chartify Alternatives
Tableau,Microsoft Power BI,Google Data Studio
Company
- Website: https://www.chartify.ai
- Company Name: Chartify
- Support Email: [email protected]
- Facebook: NA
- X(Twitter): NA
- YouTube: NA
- Instagram: NA
- Tiktok: NA
- LinkedIn: NA